Step-by-Step Guide to Monitoring Google Cloud with Grafana

Introduction
Managing and monitoring your Google Cloud Platform (GCP) resources is crucial for maintaining optimal performance and identifying potential issues. While GCP offers its own monitoring tools, integrating them with a powerful visualisation platform like Grafana can take your monitoring game to the next level. This blog will guide you through setting up a self-hosted Grafana server on a GCP VM and leveraging it to monitor your cloud resources.
What is Grafana?
Grafana is an open-source platform that allows you to create interactive dashboards to visualise metrics, logs, and traces from various data sources. It excels at transforming complex data sets into easily digestible charts, graphs, and other visual elements, enabling you to gain deeper insights into your system’s health and performance.

Grafana OSS vs Grafana Cloud
Grafana comes in two flavours: Open Source (OSS) and Cloud. The OSS version offers complete control and customisation but requires self-hosting and maintenance. Grafana Cloud provides a managed service with features like automatic scaling and enterprise-grade security, ideal for those seeking a hassle-free experience.
You can find more details on Grafana Cloud vs OSS version here : https://grafana.com/oss-vs-cloud/
In this article we are focusing Grafana OSS version i.e self hosted Grafana.
Creating Your Own Grafana Server on a GCP VM
Provision a GCP VM: Choose a suitable VM instance type based on your expected load.I created basic Debian VM.
Install Grafana: Follow the official Grafana installation guide for your chosen operating system (e.g., Ubuntu, Debian). You can find download instructions here : https://grafana.com/grafana/download/10.4.0?edition=oss
Once Installed Grafana start server.

Login and Access Grafana: Access the Grafana web interface (usually http://<VM_IP>:3000)

you can find login credentials in grafana.ini file.

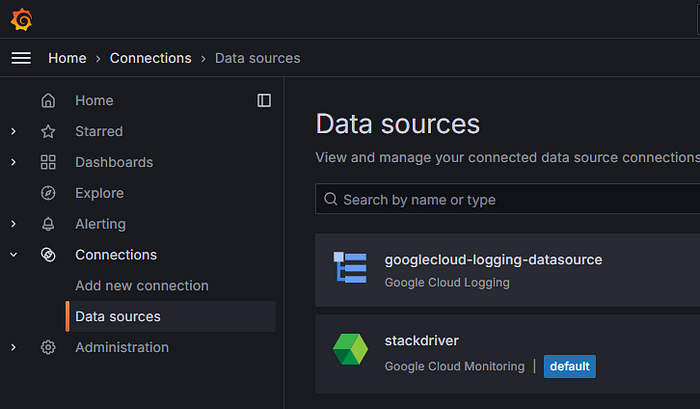
Navigate to Connections -> New Connection → Add Data source and Add below two datasource Plugins for Google Cloud Monitoring & Google Cloud Logging.

Set Up Authentication and Test the connection between Grafana and your GCP project to ensure data can be retrieved successfully.

Importing Built-in Dashboards & Building Custom Dashboards
Grafana offers a wide range of pre-built dashboards for various GCP services. You can import these dashboards and customize them to fit your specific needs. Additionally, Grafana’s intuitive interface allows you to build custom dashboards from scratch, enabling you to visualize the metrics that matter most to you.

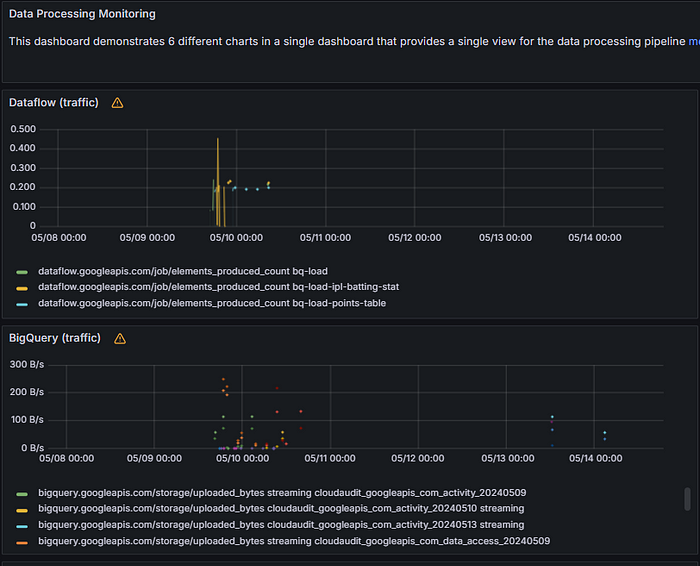
Sample Dashboards


Logging

Checking Errors

YouTube Video Demo
For a more detailed visual walk through, check out this helpful YouTube video demonstration (link to your video here).
Conclusion
By setting up a self-hosted Grafana server on GCP, you gain a powerful tool to monitor and visualise your Google Cloud resources effectively. This approach offers greater control and customisation while providing valuable insights into your cloud environment’s health and performance. Remember to adapt the security configuration and resource allocation based on your specific needs and environment.
About Me
As an experienced Fully certified (11x certified) Google Cloud Architect, Google Cloud champion Innovator, with over 7+ years of expertise in Google Cloud Networking,Data ,Devops, Security and ML, I am passionate about technology and innovation. Being a Champion Innovator and Google Cloud Architect, I am always exploring new ways to leverage cloud technologies to deliver innovative solutions that make a difference.
If you have any queries or would like to get in touch, you can reach me at my email address vishal.bulbule@techtrapture.com or connect with me on LinkedIn at https://www.linkedin.com/in/vishal-bulbule/. For a more personal connection, you can also find me on Instagram at https://www.instagram.com/vishal_bulbule/?hl=en.
Additionally, please check out my YouTube Channel at https://www.youtube.com/@techtrapture for tutorials and demos on Google Cloud.


